Performance Profiling
This section provides several tools to help you learn how to profile your native apps.
Android Systrace
Android Systrace is a low overhead but powerful tool that can analyze performance bottlenecks. To learn more, go to https://developer.android.com/studio/command-line/systrace
If you are using the command-line tool, the following command is an example on how to start the systrace for 5 seconds.
‘systrace.py -t 5 -b 8192 view gfx sched -a YOUR_PACKAGE_NAME’
Below is an example of a systrace result of one simple Wave VR native app.
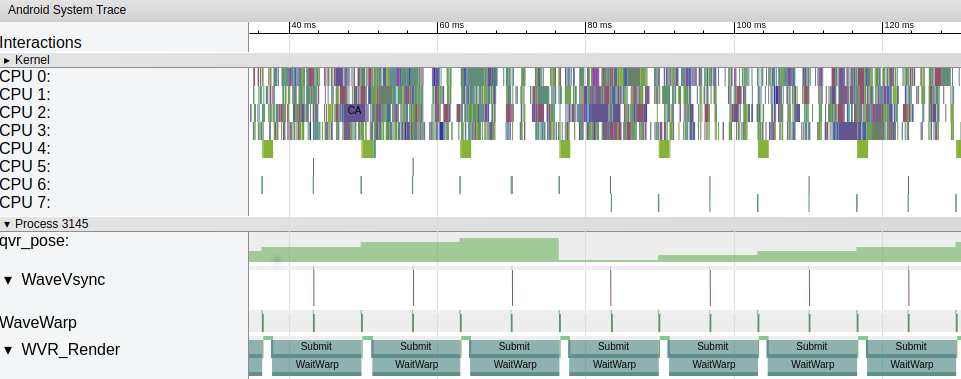
Process 3145 is a classic native Wave VR application with three active threads.
- WaveVsync is the runtime vsync thread activated once every frame to indicate the correct vsync timing for other threads.
- WaveWarp thread is the runtime warp thread activated twice every frame to do timewarp and to export the final image to the display.
Both these threads must run in correct timings and in stable time intervals to make sure that users have the best VR experience and do not see tearings or stutters.
WVR_SubmitFrame may be called in the main rendering thread, such as WVR_Render, and therefore the ‘Submit’ tag will be seen in this thread. To keep the poses stable and the images smooth, the app can only call submit once within a frame. You will see the tag ‘WaitWarp’ in the main rendering thread while the Wave runtime is waiting for the next frame to start. There might be also multiple rendering threads that are controlled by the app. Keep the load of these rendering threads as low as possible to make sure that the FPS will be high enough.
Logcat
Monitor an application’s FPS with the logcat tool from Android Studio or command line. A sample command to use this tool is
The key word of the FPS log is “FPS:” and the log will be printed once per second. According to the device you are using, you may see the following two different log patterns.
Performance HUD2.0
Performance HUD 2.0 supplies more information for tuning performance. It also has a setting app that can help developers configure items they want to monitor.
This feature is only supported on Native and Unity platforms. do not use if using Unreal Engine. Performance HUD 2.0 uses system computing resources that may have a negative impact on performance.
WaveVR App, including native, unity and unreal, using SDK 5.2.0 does not support HUD.
Note
In some cases, enable HUD may cause unexpected behavior such as some 3D objects may not be updated. Please disable HUD if such course of events are happened.
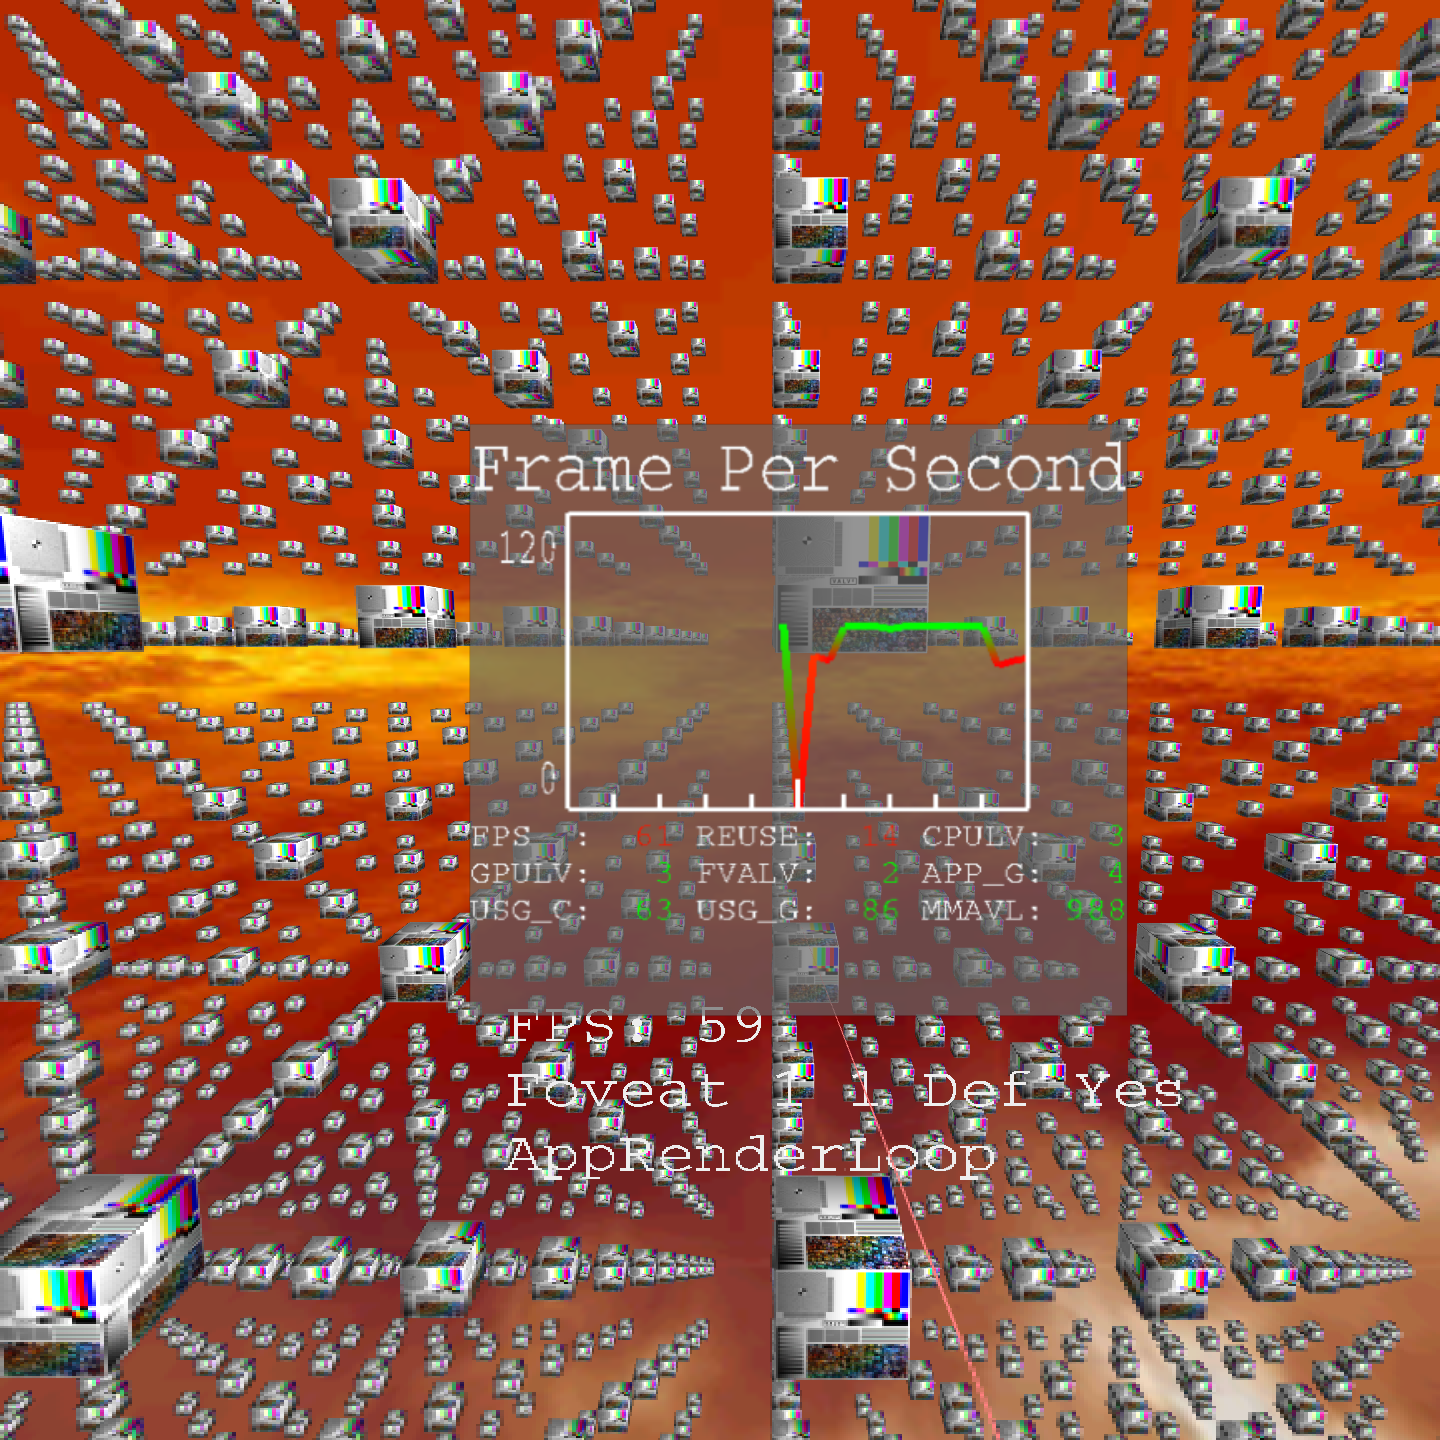
Perofrmance HUD 2.0 items
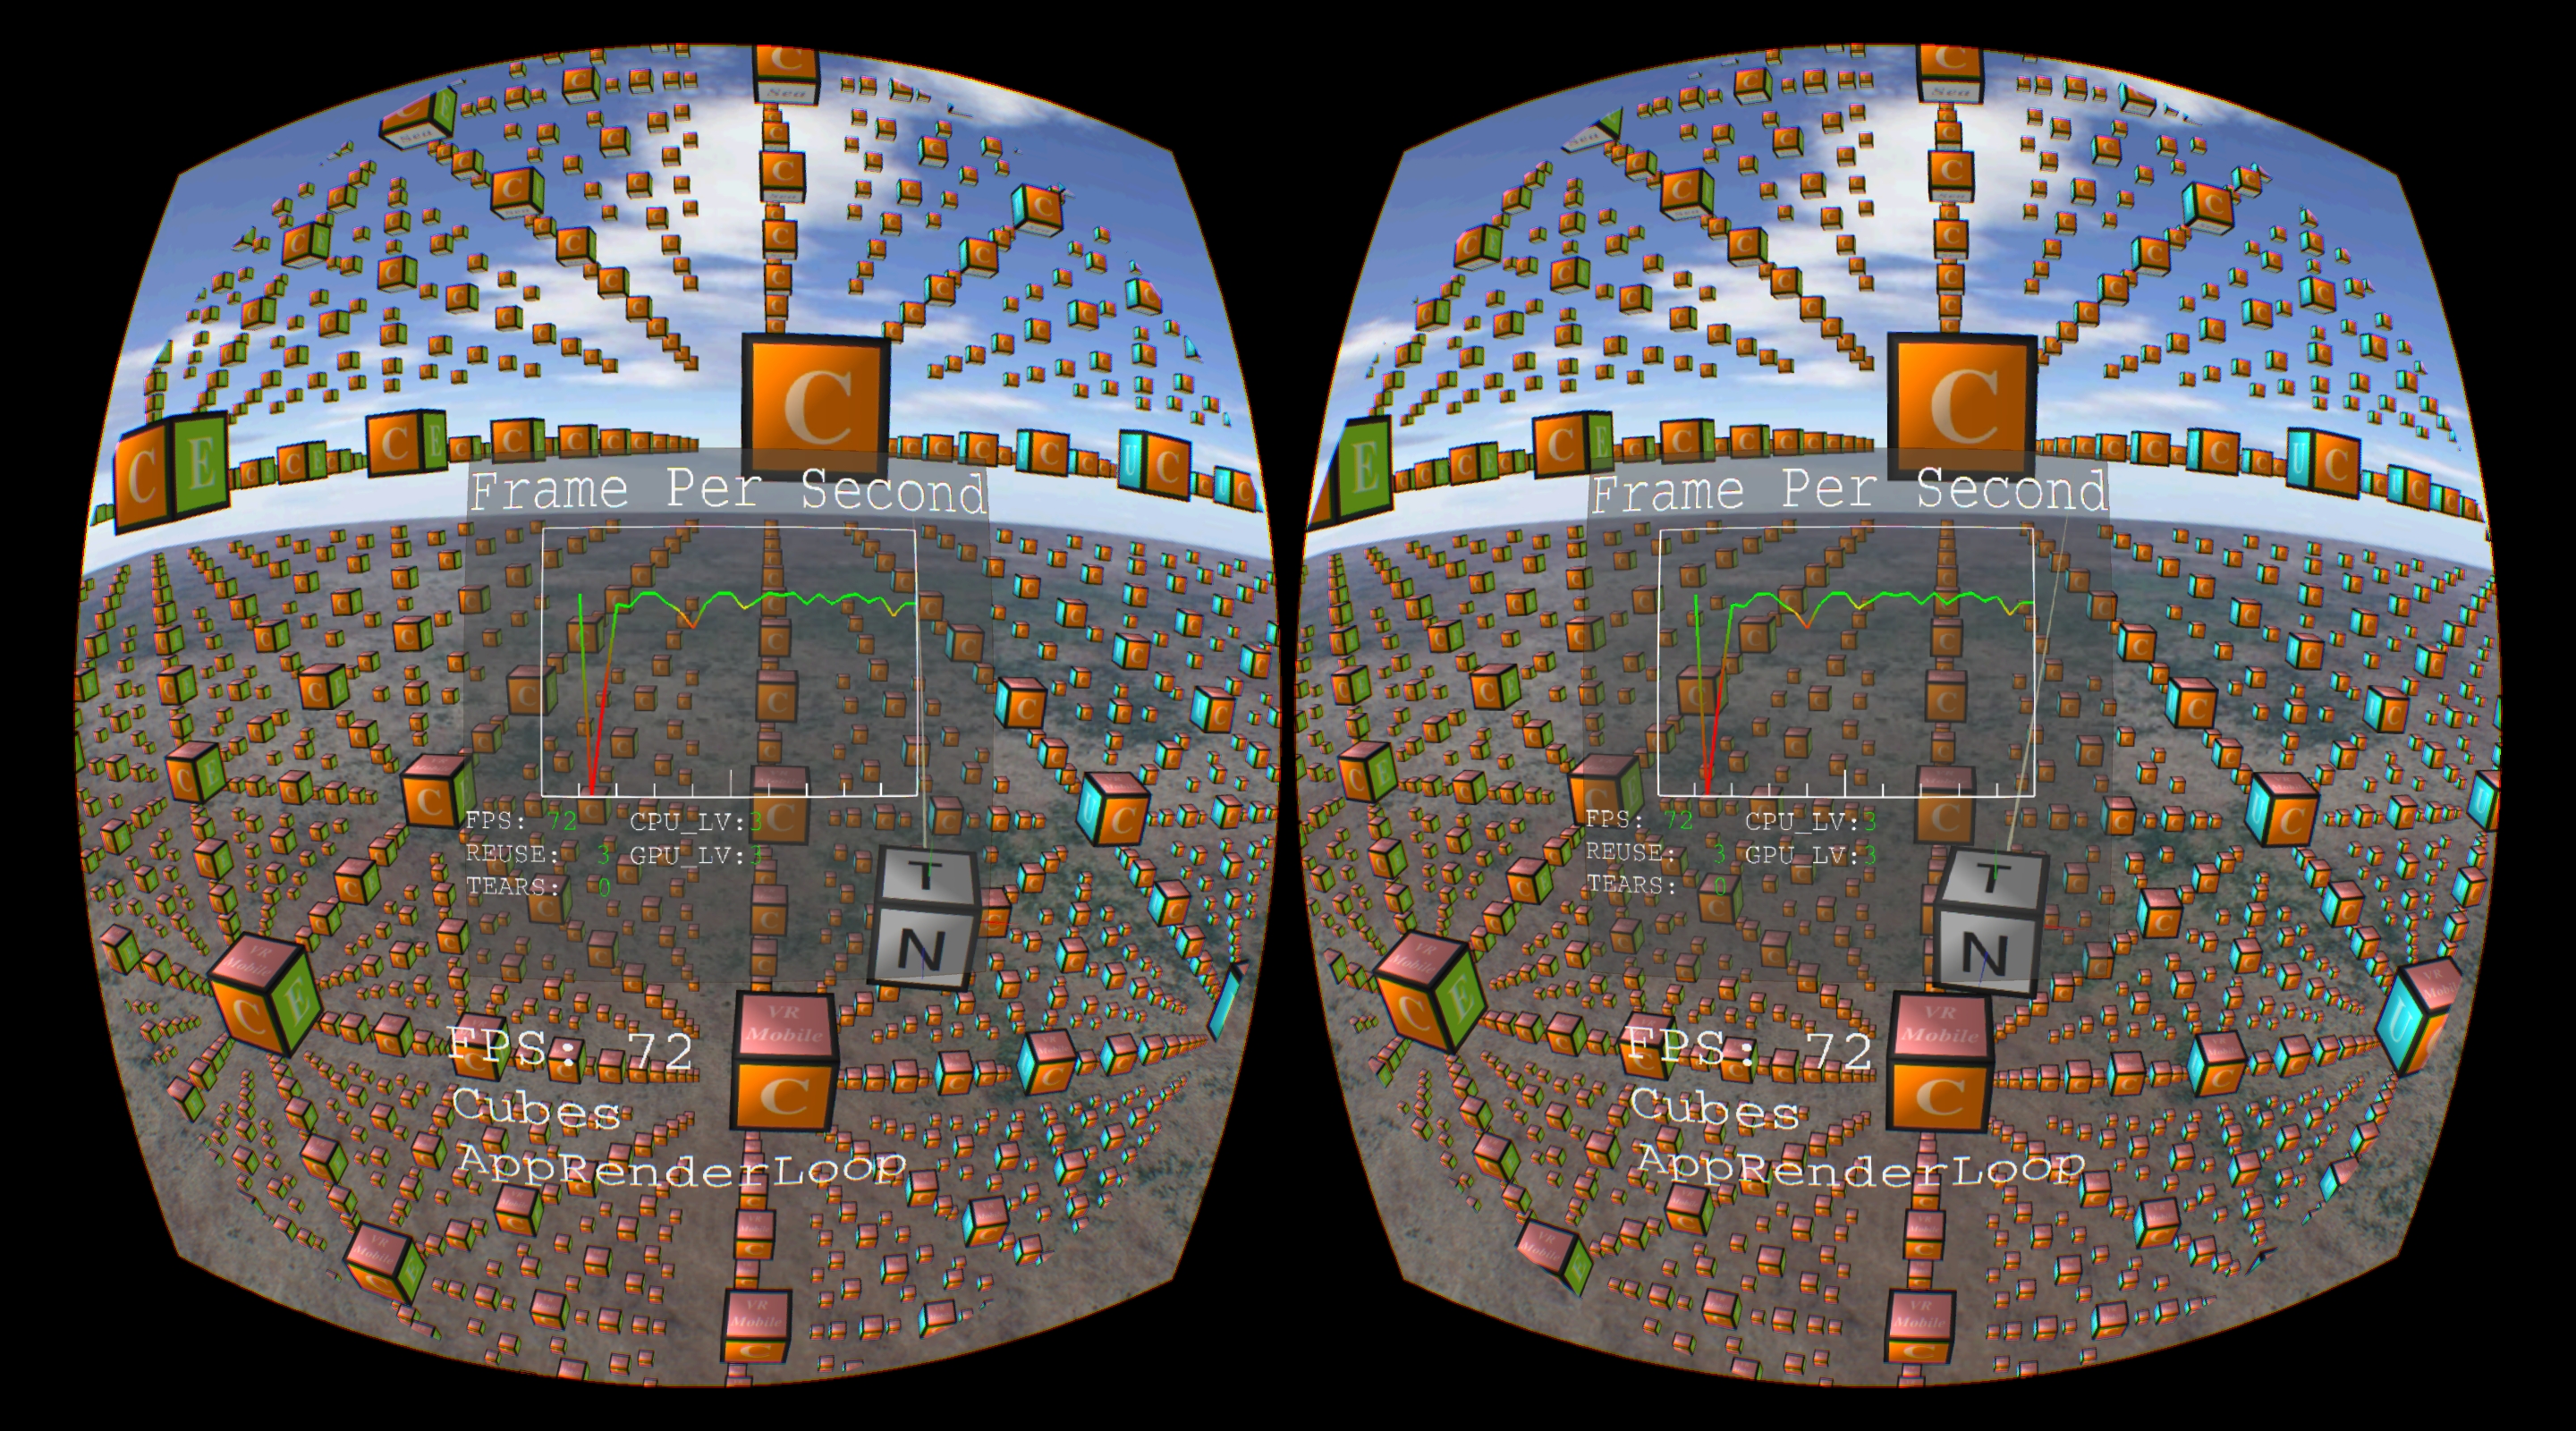
| Broken Line Graph | The latest 30 seconds FPS record. Each scale mark represents 3 seconds. |
| FPS | “Frames per second”. The frame count per second that is submitted from the render thread. This should be equal to the vSync rate in normal situations. |
| REUSE | Reused frame count per second. When the system load grows, the FPS of the render thread can not reach the warp thread’s FPS. The warp thread has to “reuse” the previous submitted frames to reach the vSync rate. |
| TEARS | Difference between the warp thread’s FPS and vSync rate. When the system load grows, the FPS of the warp thread can not reach the vSync rate. |
| CPU/GPU_LV | Set the CPU/GPU performance level by WVR_SetPerformanceLevels to achieve better performance balance. |
| Availale Memory (MMAVL) | Indicates how much memory (in MB) is available for starting new applications. |
| Display Refresh Rate (DSPRE) | Indicates the display refresh rate of the current system. This is also the Vsync rate. |
| Buffer Size (EYEBF) | Indicates the buffer size (in MB) for one eye. |
| Foveation Level (FVALV) |
|
| ATW GPU Time (ATW_G) | Indicates the total time (in ms) that ATW needs to show the image on the display. |
| App GPU Time (APP_G) | Indicates the GPU time (in ms) that an app used to generate a frame of content. |
| App CPU Time (APP_C) | Indicates the CPU time (in ms) that an app used to generate a frame of content. |
| CPU usage (USG_C) | This value reveals the percentage of current system CPU usage. |
| GPU usage (USG_G) | Indicates the current system GPU usage. |
| Pose Predict time (POSPR) | Indicates the real pose predict time (in ms) when an app generates a frame of content. |
| IPD | Indicates the IPD (in mm) used by the system. |
| Adaptive Quality (AQ) | Indicates the status of the Adaptive Quality function. Adaptive Quality may affect some system features such as the CPU/GPU level. |
HUD Setting Application
Install the HUD Setting Application
You can find the setting app in: SDK/tools/wvr_HUD2_setting_tool_v1.apk. Please use the following adb command to install the HUD setting app.
How to Use
- Launch the HUD Setting application.
- Turn on HUD Overlay. If needed, enable additional output data (HUD Log and HUD CSV). For more information about HUD Log and HUD CSV, see HUD Log and HUD CSV.
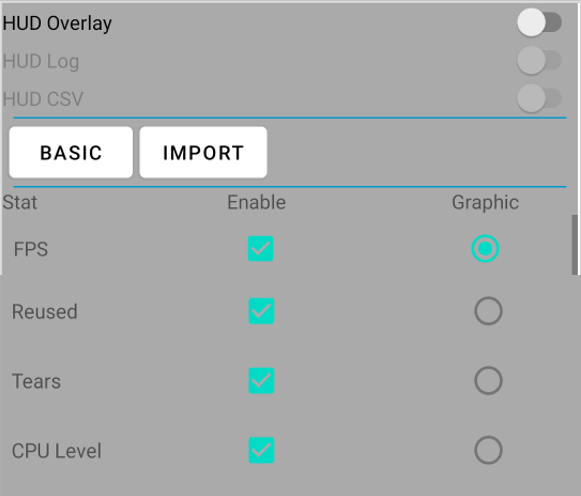
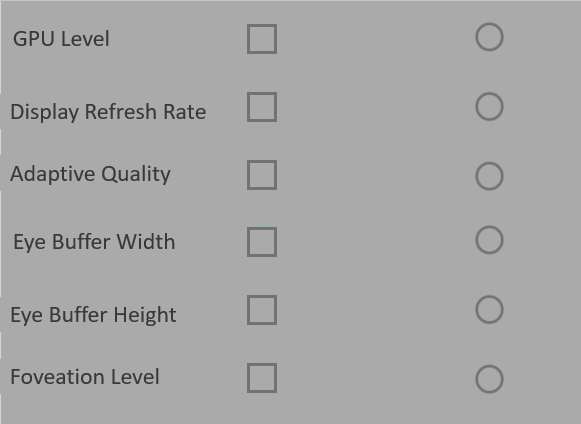
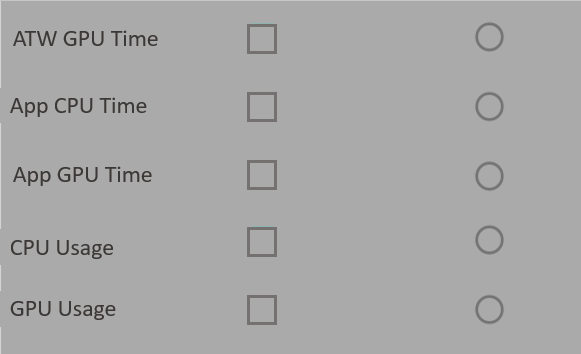

HUD can monitor 9 items at most. Setup the items to monitor by selecting the checkboxes in the column below Enable. Monitor data will be updated per second.
HUD can show just one monitor data on line chart. Setup an item you want to show on line chart by check the radio button in the column below Graphic. The data in the line chart will be updated per second.
Back to Launcher and launch the app you want to monitor.
Note
It may take time to turn on HUD and reset the system. It’s expected that black screen will be seen around 5 seconds.
HUD Log
When enabled, information from the HUD monitor is updated into the log every second. To get the log, use this command:
The log will show the following:
HUD CSV
When enabled, the HUD module creates a CSV file that has the same file name as the package name of the app that is running. Data will be inserted into the corresponding file every second. All CSV files are stored in /sdcard/HUDRecords/.
Import the Configuration File
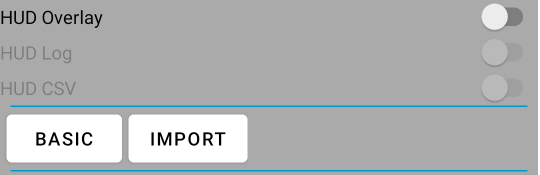
Import the configuration file by clicking IMPORT. Put the configuration file in /sdcard/HUDRecords/user_config.
Set the value to “1” for items you want to enable. An example of user_config
Performance HUD (For Legacy Devices)
Performance Heads-Up Display lets developers monitor real-time performance of their apps while wearing the headset. Although there might be a drop in FPS when using the Performance HUD, it is helpful in learning which scenes or operations in apps are using a lot of resource.
This feature is only supported on Native and Unity platforms, do not use if using Unreal Engine. Install the setting app of the Performance HUD to enable Performance HUD.
You can find the setting app in: SDK/tools/wvr_hud2_setting_tool_v1.apk
To turn on or off the Performance HUD, use the following adb commands.
- Turn on: adb shell setprop debug.wave.perfmonitor.mode 1
- Turn off: adb shell setprop debug.wave.perfmonitor.mode 0
Performance HUD items
| Broken Line Graph | The latest 30 seconds FPS record. Each scale mark represents 3 seconds. |
| FPS | “Frames per second”. The frame count per second that is submitted from the render thread. This should be equal to the vSync rate in normal situations. |
| REUSE | Reused frame count per second. When the system load grows, the FPS of the render thread can not reach the warp thread’s FPS. The warp thread has to “reuse” the previous submitted frames to reach the vSync rate. |
| TEARS | Difference between the warp thread’s FPS and vSync rate. When the system load grows, the FPS of the warp thread can not reach the vSync rate. |
| CPU/GPU_LV | Set the CPU/GPU performance level by WVR_SetPerformanceLevels to achieve better performance balance. |