RenderDoc
RenderDoc is a graphics debugger similar to the Frame Debugger in Unity. RenderDoc can capture the following data from individual frames, which can be used for tracking rendering issues:
- Graphics API Commands
- Shader
- Vertices
- Input textures
- Output textures
RenderDoc is a powerful and versatile debugging tool that is also easy to use, as the process of capturing frames from the attached XR Device can be initiated through the RenderDoc PC client without any complicated prerequisites.
This guide will only introduce basic RenderDoc usage and features provided by us. For fundamental information about RenderDoc, visit RenderDoc’s official site .
Caution
According to RenderDoc : For RenderDoc’s android support, your application must be installed and it must be debuggable. If your application is not debuggable, build a development build by enabling “Development Mode” in the Unity Build Settings.
Getting Started
Download and install the RenderDoc PC client from RenderDoc’s official site . We recommend you to use RenderDoc V1.9 as this is the version we have tested and verified.
Wave provide both normal RenderDoc capture and in-app capture types. A normal RenderDoc capture is a capture initiated from the PC client, while an in-app capture uses a script embedded in the XR Application to trigger the capture.
There are two check tables to show the supported combinations of Wave SDK Version, capture type and launch type when your XR Application is running on a certain Android Version (Combinations marked with a “✓” are supported):
| Wave SDK Version | Capture type | Android 7 | Android 10 | Embedded RenderDoc |
|---|---|---|---|---|
| 4.0.0 or newer | From PC | ✓* | ✓* | Not required |
| In-app | ✓ | ✓ | Not required | |
| Before 4.0.0 | From PC | Unsupported | ||
| In-app | ✓ | ✓ | Required | |
| Wave SDK Version | Embedded RenderDoc |
Launch type | Android 7 | Android 10 |
|---|---|---|---|---|
| 4.0.0 or newer | Yes | Launch | ||
| No | Launch | ✓ | ✓ | |
| Yes | Attach | ✓ | ✓ (Requires Setup Config 0) |
|
| No | Attach | ✓ | ✓ (Requires Setup Config 1) |
|
| Before 4.0.0 | No | Don’t care | ||
| Yes | Launch | |||
| Yes | Attach | ✓ | ✓ (Requires Setup Config 0) |
To learn more about Launch types, refer to Using the RenderDoc PC client.
Combinations marked with a ‘*’ indicate the normal RenderDoc debug workflow. You can learn how to do a normal capture from the Document and Tutorials provided by RenderDoc, or refer to the Using the RenderDoc PC client section.
To debug XR Applications built with Unity using an older Wave SDK version, refer to sections Import RenderDoc Feature Pack and Building an XR Application with embedded RenderDoc library.
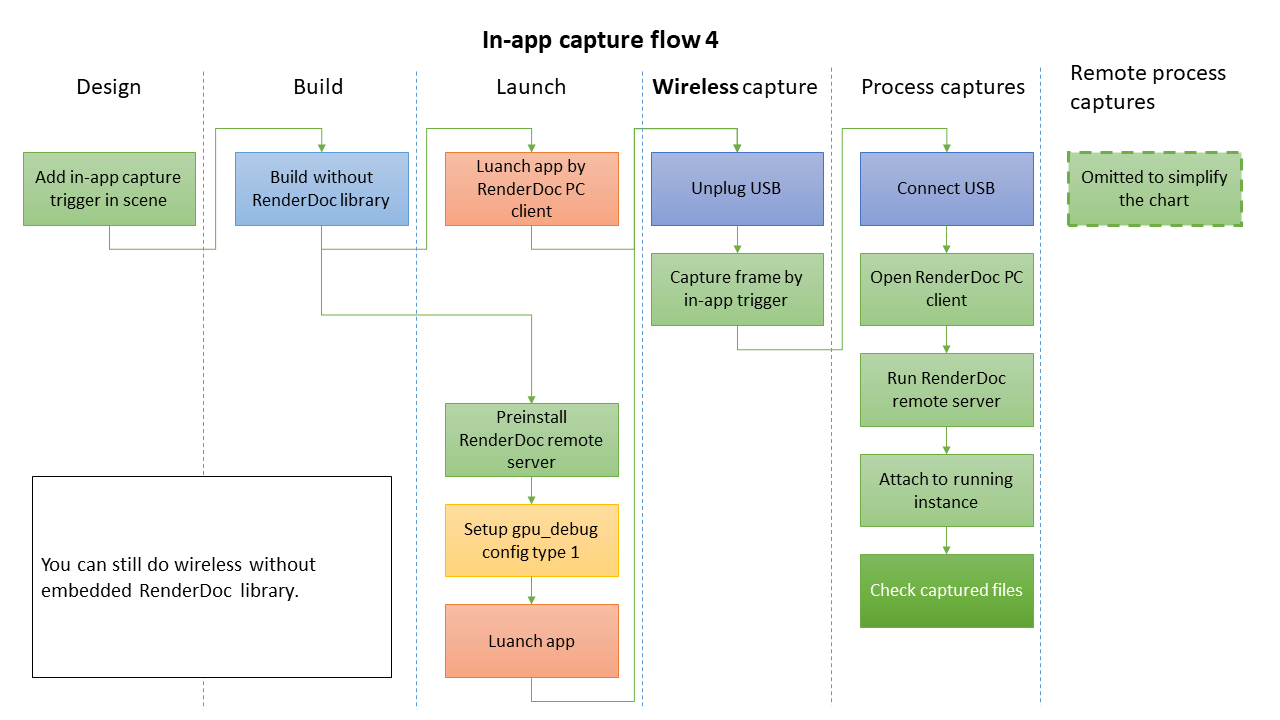
In-app capture type can be done wireless (i.e. no connection between your XR Device and the PC running the RenderDoc client is needed). You can unplug the USB cable, finish the frame capturing within your application and use Attach from the PC client to retrieve the captured data afterwards. To trigger a capture within the application, refer to the Adding an in-app capture trigger section.
| Capture type | USB Connection when Capturing | Launch Type | Rebuild Required | Android 10 |
|---|---|---|---|---|
| From PC | Required | Launch | No | Launch will help setup debug layer |
| In-app | Not Required | Launch or Attach | Yes | Manual setup or use Launch to setup once |
Import RenderDoc Feature Pack
Note
This section is for in-app capture or older Wave SDK versions. Otherwise, you can skip this section.
RenderDoc integration is an optional feature pack provided by Wave Unity XR Plugin - Essence. When using this feature pack, Wave Unity XR Plugin will be able to include the RenderDoc library into the XR application during build time, and the in-app capture trigger can be put into your scenes, i.e. RenderDoc can run and trigger captures without Launch from PC side.
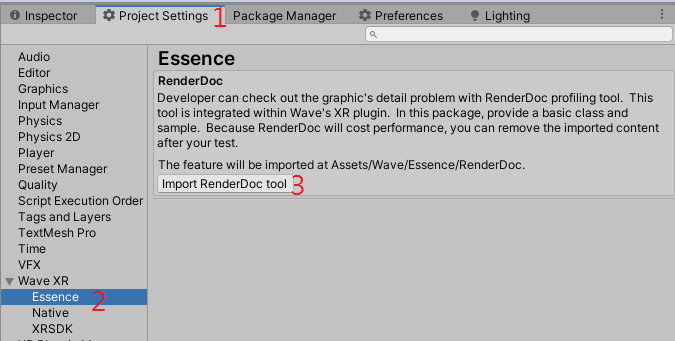
To import the feature pack, go to Project Settings > Wave XR > Essence > and Click Import RenderDoc tool.
The feature pack will be installed at Assets/Wave/Essence/RenderDoc.
Since RenderDoc integration may negatively impact performance, you should remove the imported feature pack once you no longer need it.
Building an XR Application with embedded RenderDoc library
Note
This section is made for older Wave SDK versions or the tester-checker separation use case. Otherwise, you can skip this section.
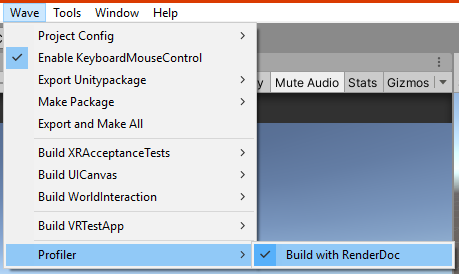
The RenderDoc’s library will be embedded into your APK if you check the following option: Menu > Wave > Profiler > Build with RenderDoc.
This option is disabled by default. If enabled, a RenderDoc library will be first copied to Assets/Plugin/Android, and then the library will be included into your XR application during build time.
The application built with RenderDoc library will run the RenderDoc profiler when the application is launched, and the RenderDoc profiler cannot be stopped. The profiler will run in following situations:
- Application is running on Android 7
- Application is running on Android 10 and the gpu_debug_app settings are configured
As the RenderDoc profiler will negatively impact performance when it is running, you should disable the option if your profiling tasks are done.
Currently, the RenderDoc library included in the feature pack is from RenderDoc V1.9. If you want to use another RenderDoc version, copy the library of that RenderDoc version to Assets/Plugin/Android and disable the Build with RenderDoc option since your own copy will be overwritten by us during build time if enabled.
Note
Only one CPU architecture is supported per build currently. Choose either ARMv7 or ARM64 under Target Architectures in Player Settings.
Adding an in-app capture trigger
In-app capture can be triggered when using both Attach and Launch launch types.
The class Wave.XR.Profiler.RenderDoc provides 3 APIs to trigger the frame capture.
void CaptureFrame(uint frameCount);
void SetAutoCapture(bool enable, uint frameGap, uint frameCount);
void IsAvailable();
CaptureFramecaptures aframeCountnumber of frames once invoked.SetAutoCapturewill automatically capture aframeCountnumber of frames everyframeGapnumber of frames whenenableis true. To disable auto capture, setenableto false.IsAvailableis used to check if RenderDoc library is loaded.
The frameCount number should not set too much. When capturing, the time of screen been blocked will be increased by the number of frameCount.
The following sample code demonstrates how to trigger a capture in your XR application by using these APIs:
using Wave.XR.Profiler;

void OnClicked() {
    if (RenderDoc.IsAvailable != null && RenderDoc.IsAvailable())
    {
        CaptureFrame?.Invoke(1);
    }
}
For further information, refer to the RenderDocSample scene, which is included in the RenderDoc integration feature pack. In this sample, the Menu button is used for triggering the capture.
RenderDoc Capture workflow charts
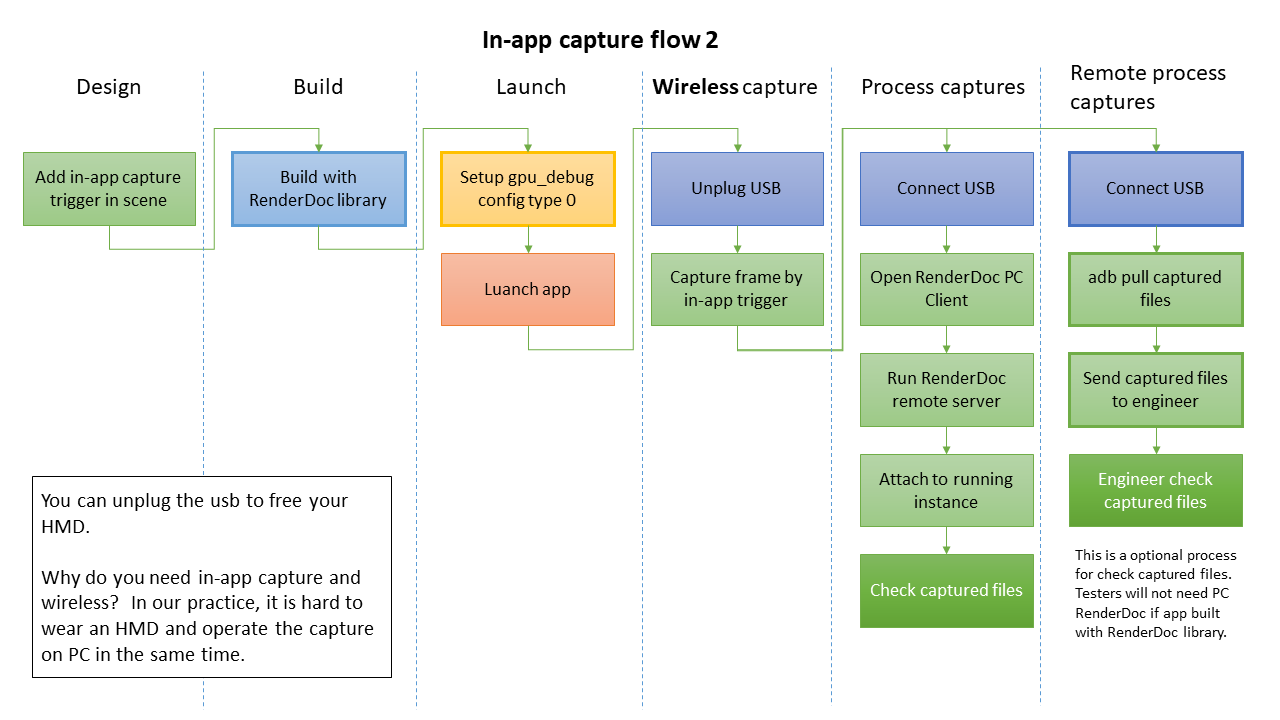
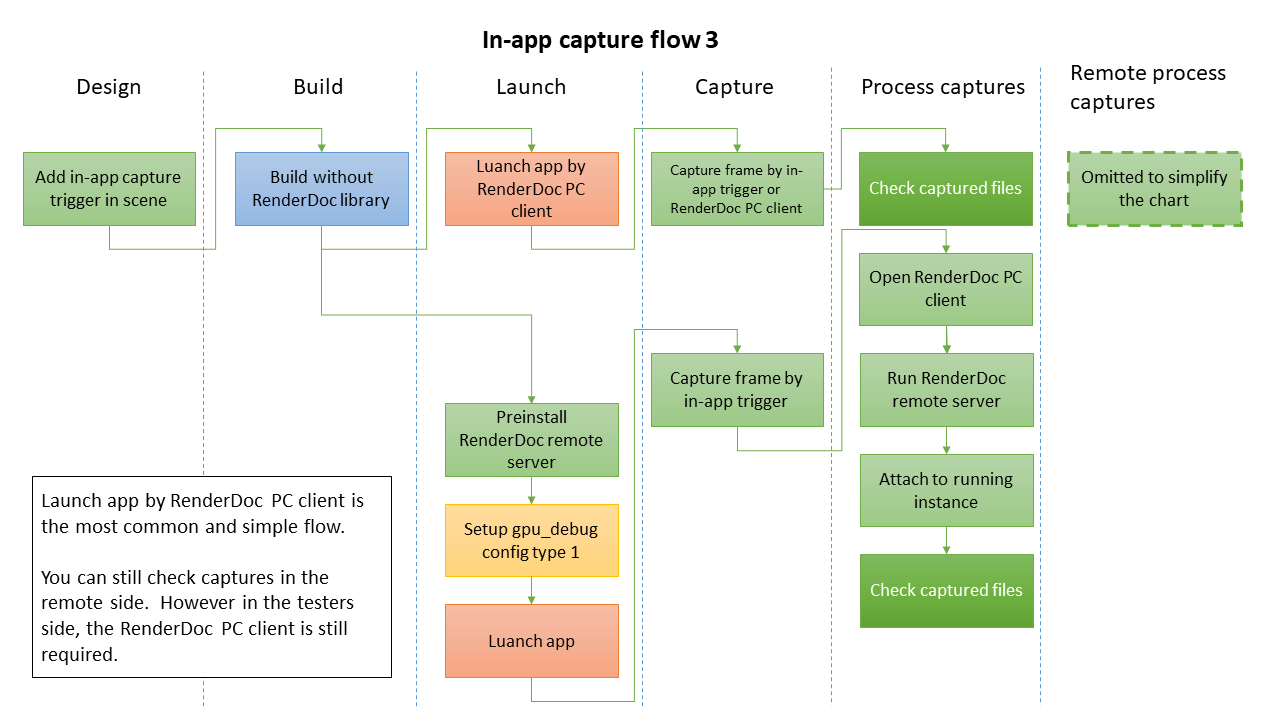
The flow charts here show different types of workflow when using in-app capture. Choose a suitable workflow that suits your purpose.
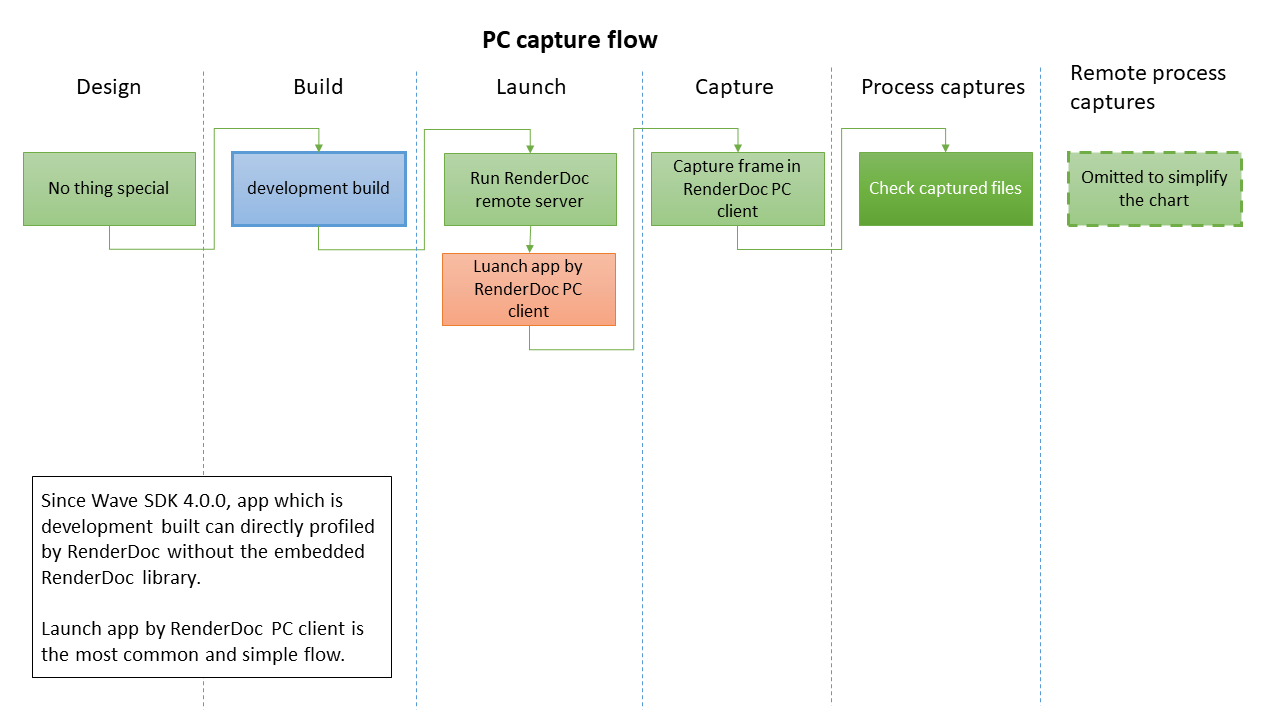
Workflow 1
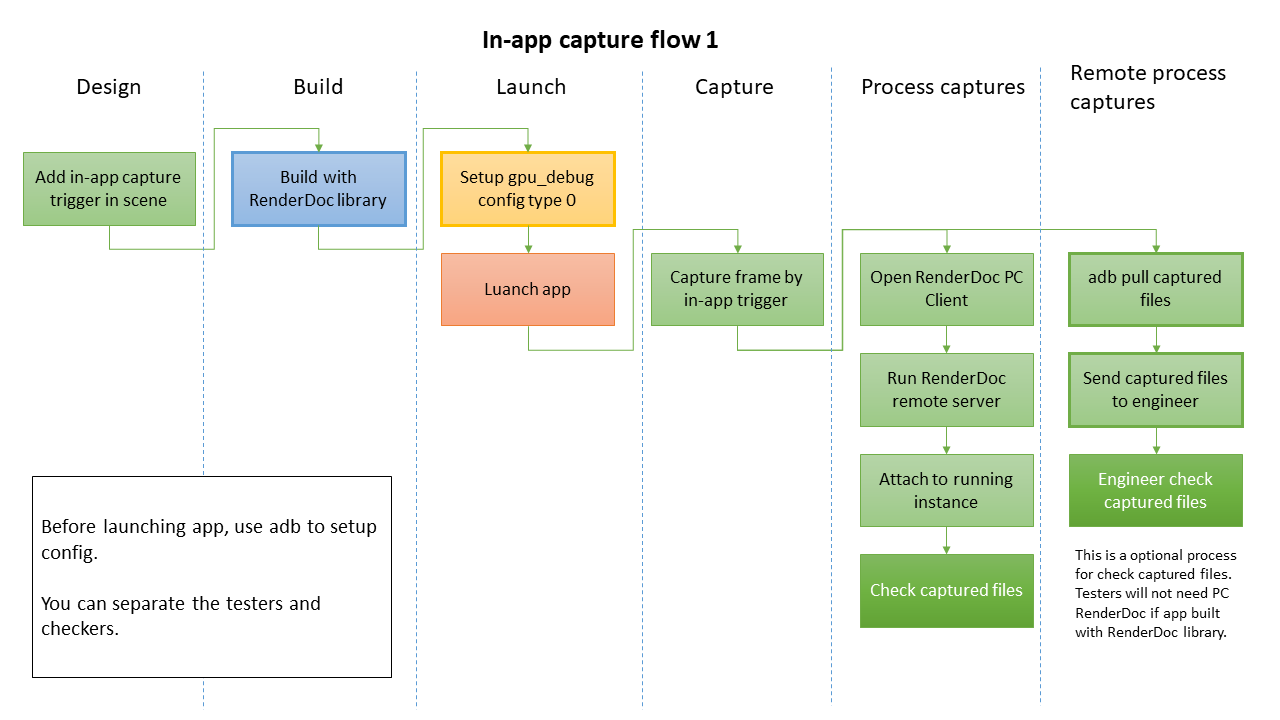
Workflow 2
Workflow 3
Workflow 4
Workflow 5
Tester-Checker separation use case
If your application is built with the embedded RenderDoc library, you can run the capture without having to install the RenderDoc PC Client in the tester’s environment.
Before the tester launches the application, Setup Config 0 should be setup. See the Graphic Debug Layer (Android 10) section for the configs.
After capturing, the captured files can be pulled by adb command and then sent to an engineer for further analysis. See the RenderDoc Captured Files section for more information.
Graphic Debug Layer (Android 10)
In Android 10, RenderDoc needs some Android Developer Settings to be enabled in order to debug. The following commands will be set by RenderDoc if you launch your application using RenderDoc or can also be set manually.
Use this shell script RenderDocDebugLayerConfig.sh to help you setup the required config or manually input following commands:
- Setup Config 0
adb shell settings put global enable_gpu_debug_layers 1
adb shell settings put global gpu_debug_app <com.your.package.name>
adb shell settings delete global gpu_debug_layer_app
adb shell settings put global gpu_debug_layers VK_LAYER_RENDERDOC_Capture
adb shell settings put global gpu_debug_layers_gles libVkLayer_GLES_RenderDoc.so
Config 0 is for apps that have the RenderDoc library embedded during build time. Replace <com.your.package.name> with the package name of your application.
- Setup Config 1
adb shell settings put global enable_gpu_debug_layers 1
adb shell settings put global gpu_debug_app <com.your.package.name>
adb shell settings put global gpu_debug_layer_app org.renderdoc.renderdoccmd.arm64
adb shell settings put global gpu_debug_layers VK_LAYER_RENDERDOC_Capture
adb shell settings put global gpu_debug_layers_gles libVkLayer_GLES_RenderDoc.so
Config 1 is for apps that do not have the RenderDoc library embedded during build time and the RenderDoc remote service is pre-installed. Replace <com.your.package.name> with the package name of your application.
Note
When RenderDoc’s remote server is launched or a captured file is opened by RenderDoc’s PC client, these above configs will be cleared and should be setup again before the application to be debugged is launched next time.
RenderDoc Captured Files
The captured files have the *.rdc extension. You can download the captured files to your PC with the following command:
adb pull //sdcard/Android/data/<com.your.package.name>/files/RenderDoc
Using the RenderDoc PC client
Launch the installed RenderDoc PC client on your computer. Connect the XR Device to your computer with USB and make sure ADB is working.
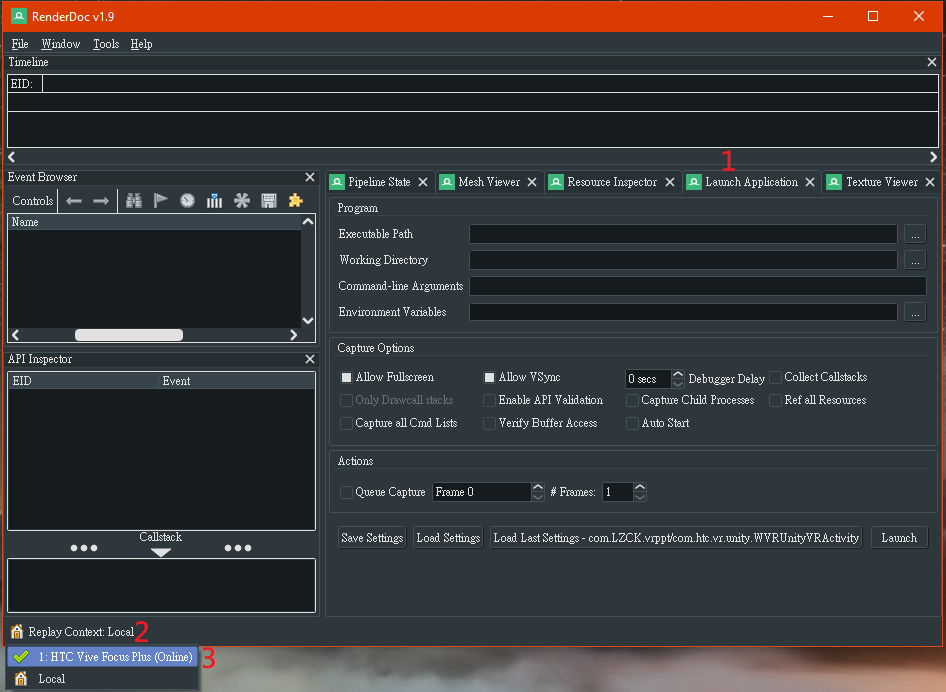
On the bottom left corner of the window, click on the Replay Context button, and select the connected XR Device you want to debug your application with.
After selecting the XR Device, a RenderDoc remote server will be launched on your XR Device. Wait until the server is ready.
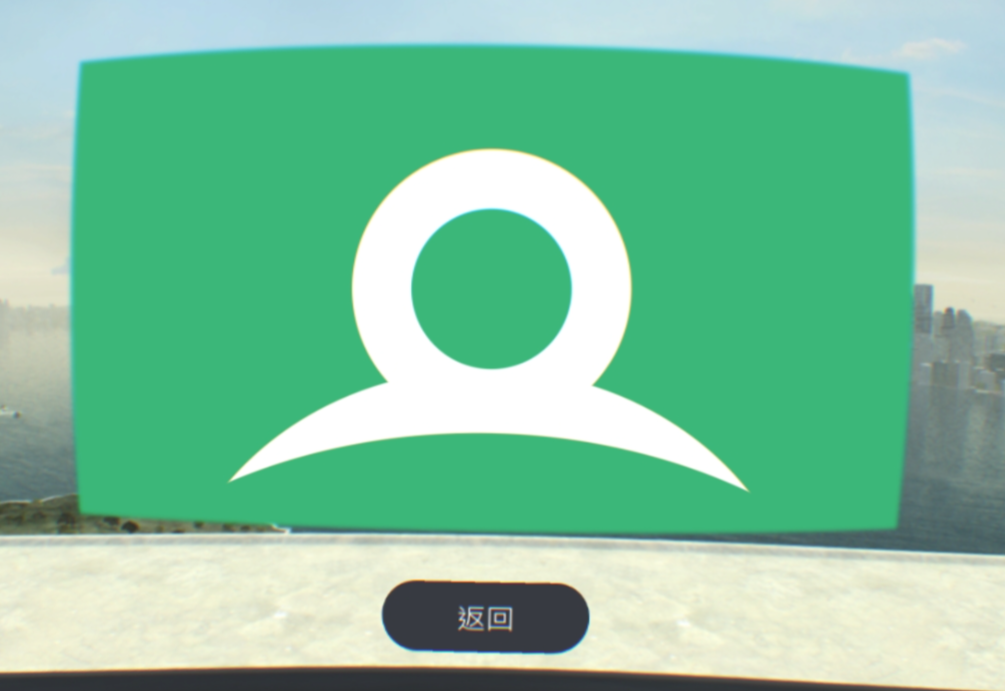
On your XR Device (Focus Plus in this case), the following view may appear:
Now you can choose to launch your XR application through RenderDoc if the XR application is not launched or you can attach to a running process.
If you are unable to return to the device launcher when the RenderDoc’s service is running, see the Leaving the RenderDoc service 2D screen section for a solution.
Launching a XR application through RenderDoc
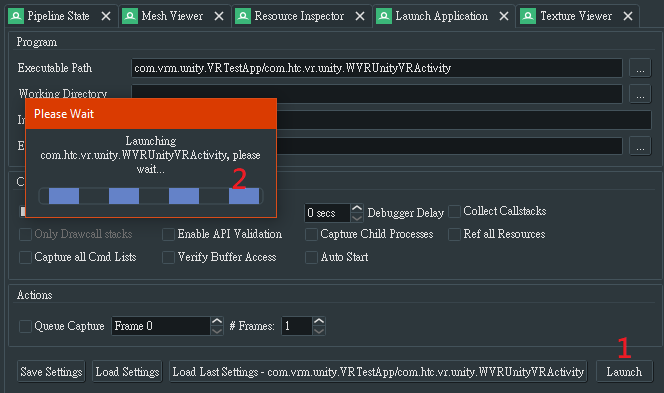
Go to the Launch Application Page, select
...under Executable Path, and choose the XR application and activity you want to launch.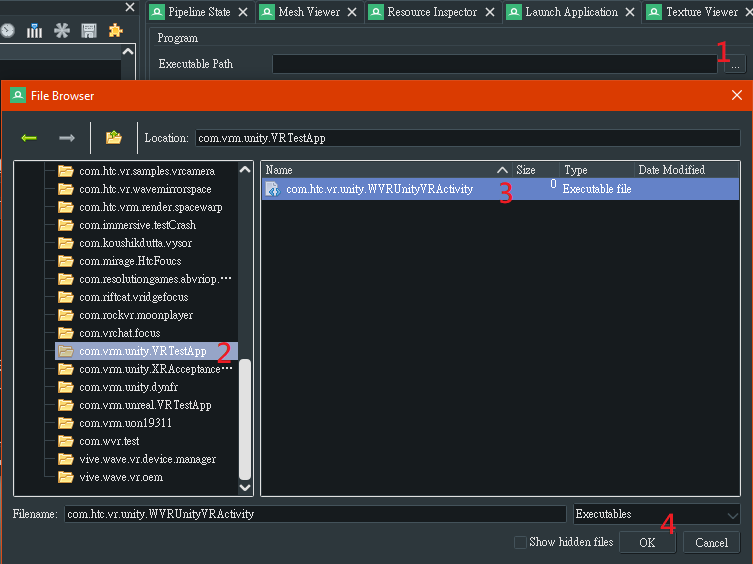
Click the Launch button, and wait until it completes.
Attaching to an instance
You can attach RenderDoc to an application instance that is already running. See Workflow 3 and Workflow 5 in the RenderDoc Capture workflow charts section for more information.
Note
If the Android OS version of your XR Device is higher than Q (10), it required that the Graphic Debug Layer Android Developer Settings and other related settings are enabled. For more information, refer to the Graphic Debug Layer (Android 10) section.
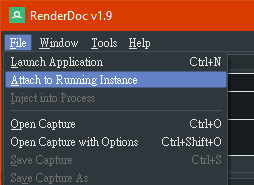
Click
Menu > File > Attach to running instance.Then choose your application and connect to it.
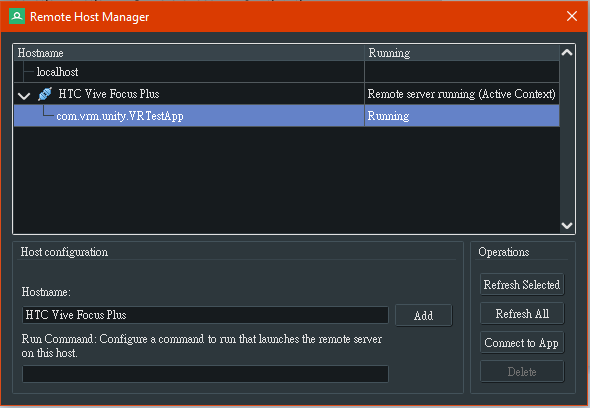
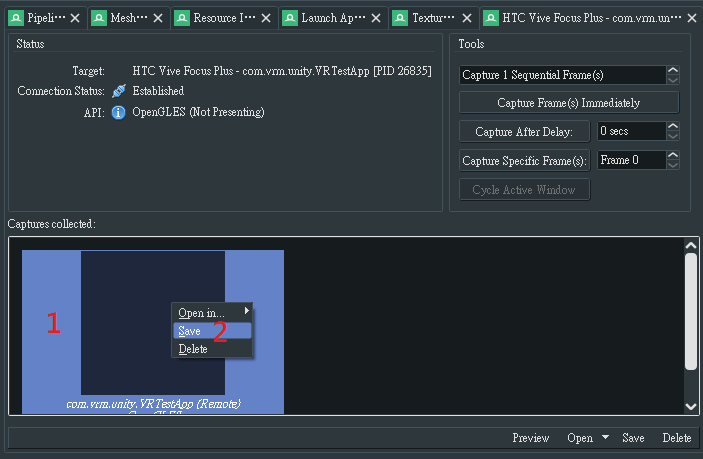
If RenderDoc is successfully connected to the application by either Launch or Attach, you will be directed to a new page.
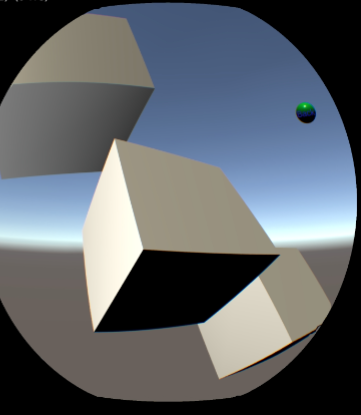
When a capture is triggered, a capture file will appear in the Captures collected section of the page. You can double click to open the capture file or save it to your disk. You can replay the capture file on your XR Device without launching your application. As an example, we have captured some frames when the RenderDocSample scene included in the feature pack is loaded when running VRTestApp.
In the RenderDocSample scene, there are three Cubes, a default skybox, and a green sphere that acts as a back button.
After opening the capture file, you will be greeted with an assortment of inspectors and browsers:
An API command Timeline is on the top.
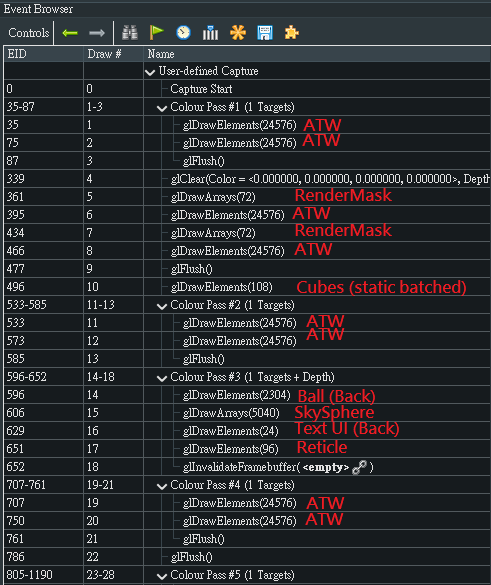
The Event Browser on the upper left shows the collection of all the draw calls executed during the capture.
The API Inspector will show all API commands executed in the draw call you have selected in the Event Browser.
The Texture Viewer tab will show the input and output textures.
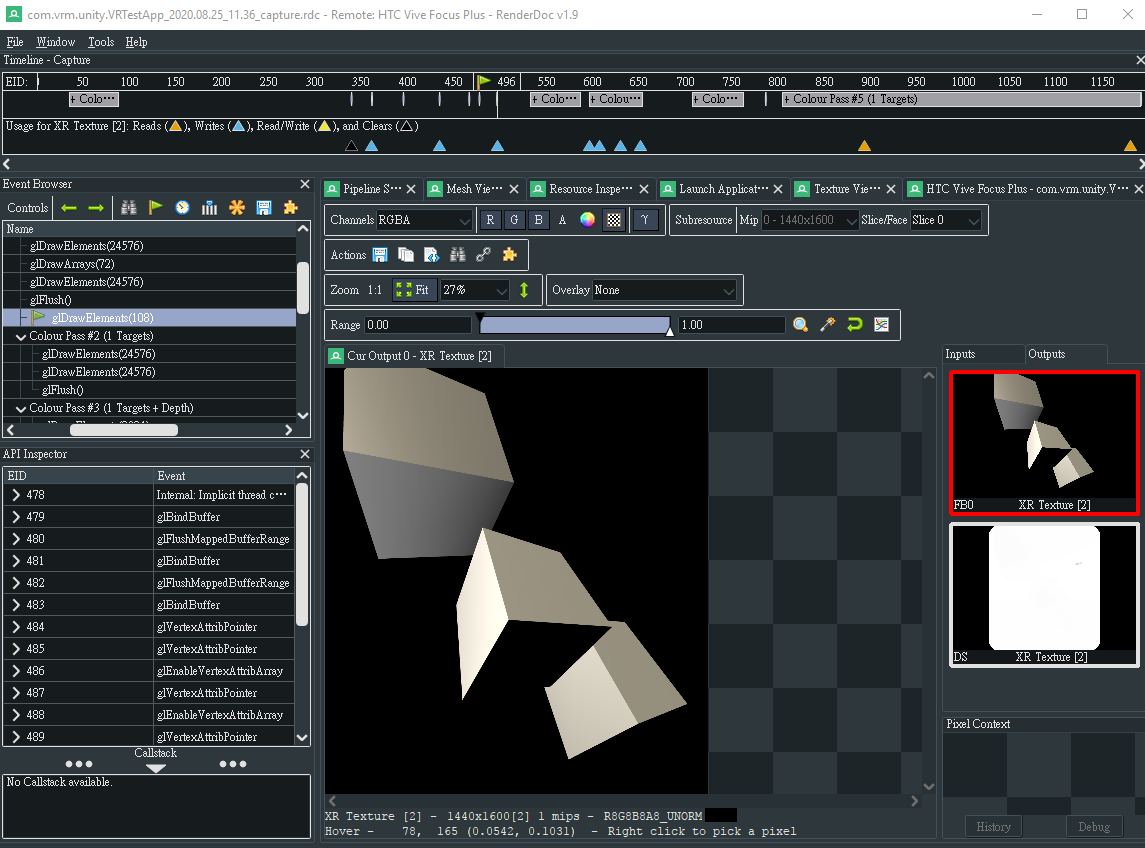
In the Event Browser, you might get confused as there are two threads responsible for rendering in Wave. One thread is the render thread created by Unity, and the other is the ATW thread. Draw calls made from the ATW thread can be ignored. Here are some notes on how to read the draw calls:
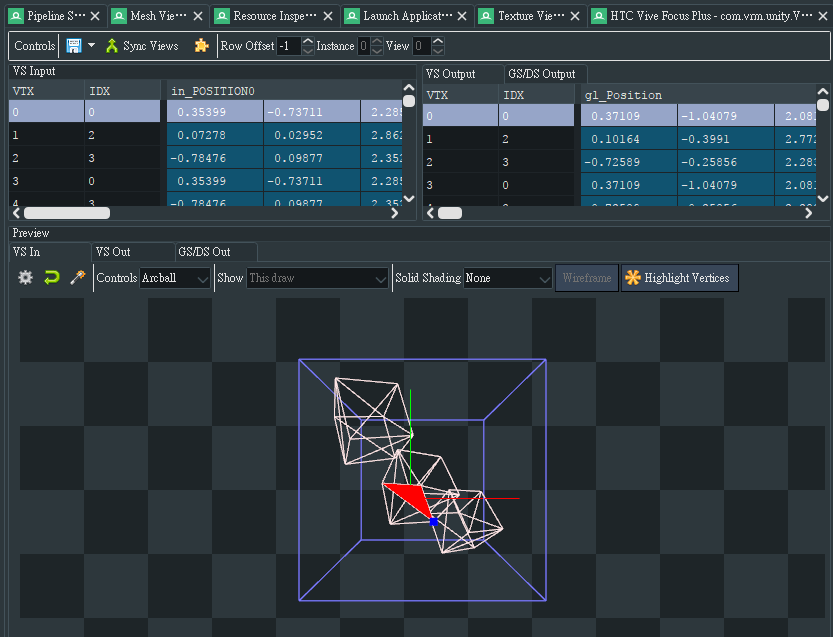
The Mesh Viewer shows the mesh drawn by the draw call you selected.
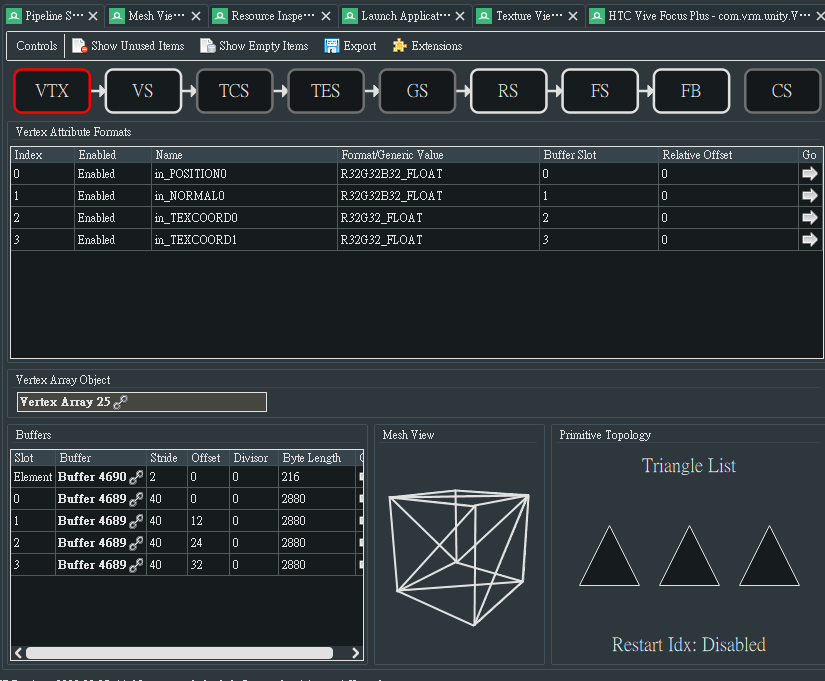
The Pipeline State shows resources such as buffers and shaders used in the draw call you selected.
For more detailed information, visit the official website of RenderDoc.
Leaving the RenderDoc service 2D screen
When RenderDoc service is launched, a 2D application will be shown. As some devices do not have the 2D VRDisplay feature, it is impossible to leave the app and return to the launcher by using VR controllers. Instead, adb commands can be used to do so:
First, find the package name of the launcher by using the following command that shows all of the names of the packages installed on your device.
adb shell cmd package list packages
Then use the following command to start the launcher activity to return to the launcher:
adb shell am start <com.launcher.package.name>/<com.launcher.activity.name>
Replace <com.launcher.package.name> with the package name of the launcher and <com.launcher.activity.name> with the activity name of the launcher, e.g. com.htc.vrs.launcher/com.htc.vr.unity.WVRUnityVRActivity.
RenderDoc Symptoms
As RenderDoc will hook into the graphic API commands for profiling, the XR application running with RenderDoc will have rendering defects, tearing, and low FPS. Also, when RenderDoc is capturing, the screen of the XR application will freeze intermittently. The tearing effect and screen freezing do not affect the captured file.
